
About the Platform
DiseasesMapMx is an independent scientific visualization initiative focused on genomic surveillance and molecular epidemiology of swine pathogens in Mexico. The platform integrates genomic, molecular, and epidemiological metadata associated with PRRSV and PCV2 circulation, allowing interactive exploration of spatial, temporal, and molecular patterns relevant to swine health and disease surveillance.
Scientific Researcher, Founder and Lead Developer

Academic Profiles
Scientific and Technical Collaboration
José Francisco Rivera Benítez
Scientific research collaborator focused on viral and molecular diagnostics and laboratory support for research and epidemiological surveillance activities associated with the detection and characterization of infectious diseases in pigs.
Researcher at the National Institute for Forestry, Agricultural and Livestock Research (INIFAP), Mexico, affiliated with the National Disciplinary Research Center for Animal Health and Food Safety (CENID-SAI), Palo Alto.
Member of the Mexican Academy of Sciences, in recognition of his scientific contributions to veterinary virology.
Academic Profiles

Institutional Collaboration and Data Attribution
DiseasesMapMx is an independent scientific visualization and epidemiological surveillance initiative developed for research, academic, and informational purposes. The platform integrates publicly available genomic information and epidemiological metadata associated with swine pathogen surveillance and scientific research activities conducted in Mexico.
Field collaboration, laboratory activities, and data generation processes have involved collaborating institutions, researchers, and swine health stakeholders. Institutional affiliations are presented for scientific attribution and collaboration acknowledgment and do not imply that DiseasesMapMx is an official institutional surveillance system.
How to Use the Dashboard
The dashboard is intended for exploratory visualization of curated, non-identifying molecular surveillance metadata. Maps, graphs, and tables are descriptive summaries rather than official estimates of prevalence, incidence, or farm-level disease status.
- Select. Choose the pathogen or group of records of interest.
- Filter. Restrict the view by year, region, production stage, gene, or lineage.
- Explore. Review maps, indicators, temporal patterns, and molecular summaries.
- Contextualize. Use tables and GenBank links to inspect record-level context.
- Interpret. Treat patterns as hypothesis-generating evidence for follow-up analysis.
About the Sequence Analysis Module
The PRRSV-2 ORF5 module performs preliminary closest-reference screening against a curated reference panel. It is not a diagnostic report or formal phylogenetic placement; interpretation requires sequence-quality review, reference-panel context, phylogenetic analysis, epidemiological information, and expert judgment.
- Input. Provide a PRRSV-2 ORF5 sequence in FASTA or raw nucleotide format.
- Validate. Check sequence characters, length, coverage, and the low-identity gate.
- Screen. Compare the query against curated closest-reference signals.
- Contextualize. Review master-tree context and GP5 amino acid differences.
- Review. Interpret results scientifically; authorized submissions remain private unless deliberately released.
Platform Architecture and Analysis Engine
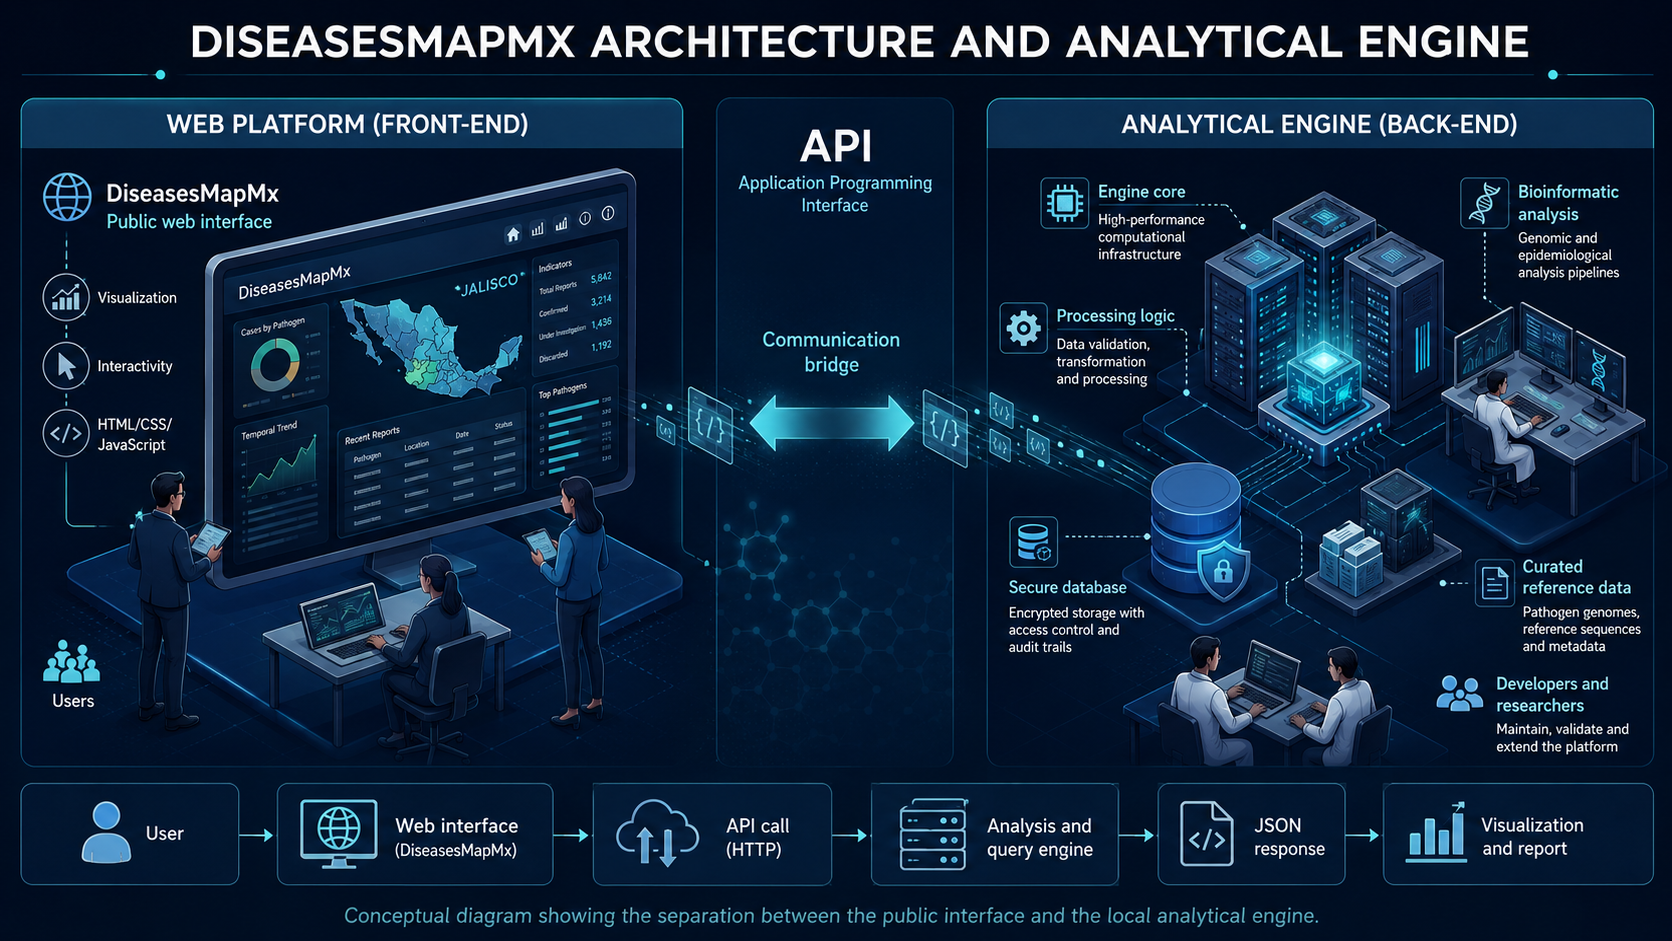
DiseasesMapMx separates its public web interface from the analytical engine. The public layer supports visualization, request submission, and result display, while controlled analytical services perform validation, processing, curated-reference queries, and structured result delivery.